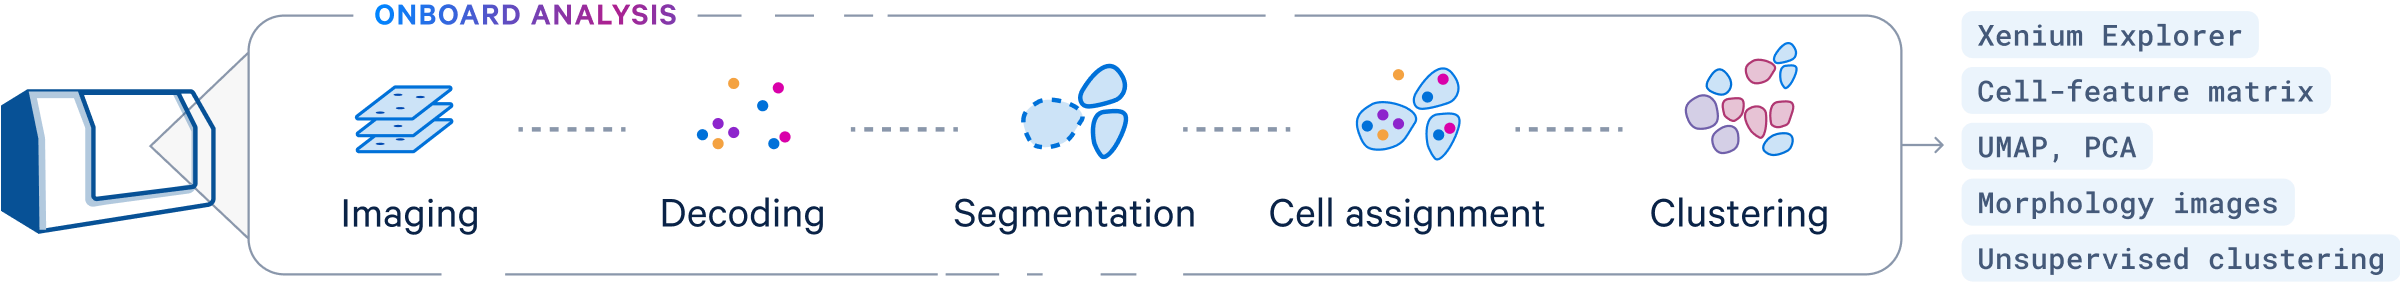
Start exploring the data right after a run completes
Xenium processes data in parallel with imaging and biochemistry cycles, allowing for immediate access to interpretation-ready data, without time-consuming steps post-run.
Immediate confidence in your data
Perform on instrument QC quickly and easily before exploring the data further in Xenium Explorer.
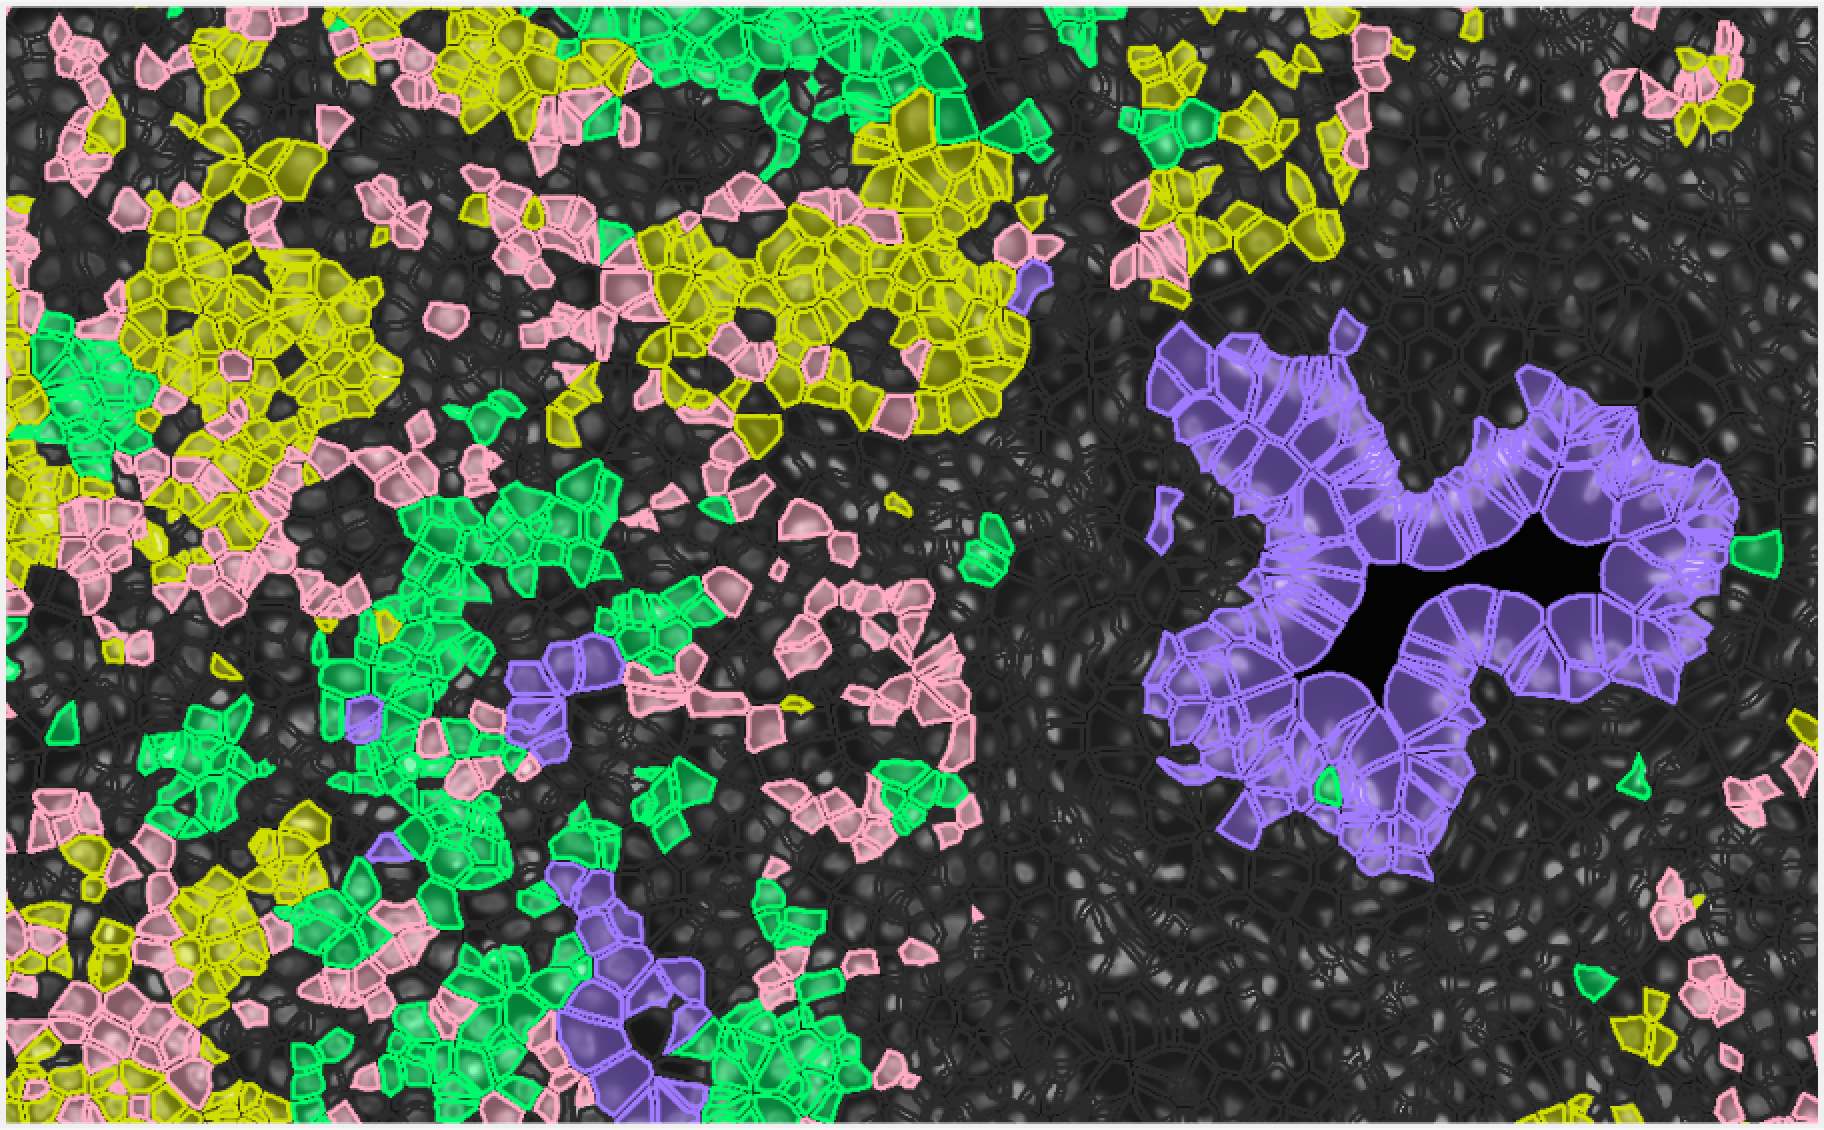
Generate true single cell spatial data with multimodal segmentation
Trained on Xenium data, our AI algorithm provides flexible segmentation. It uses the best available signal for each cell and labels each cell with its segmentation method.
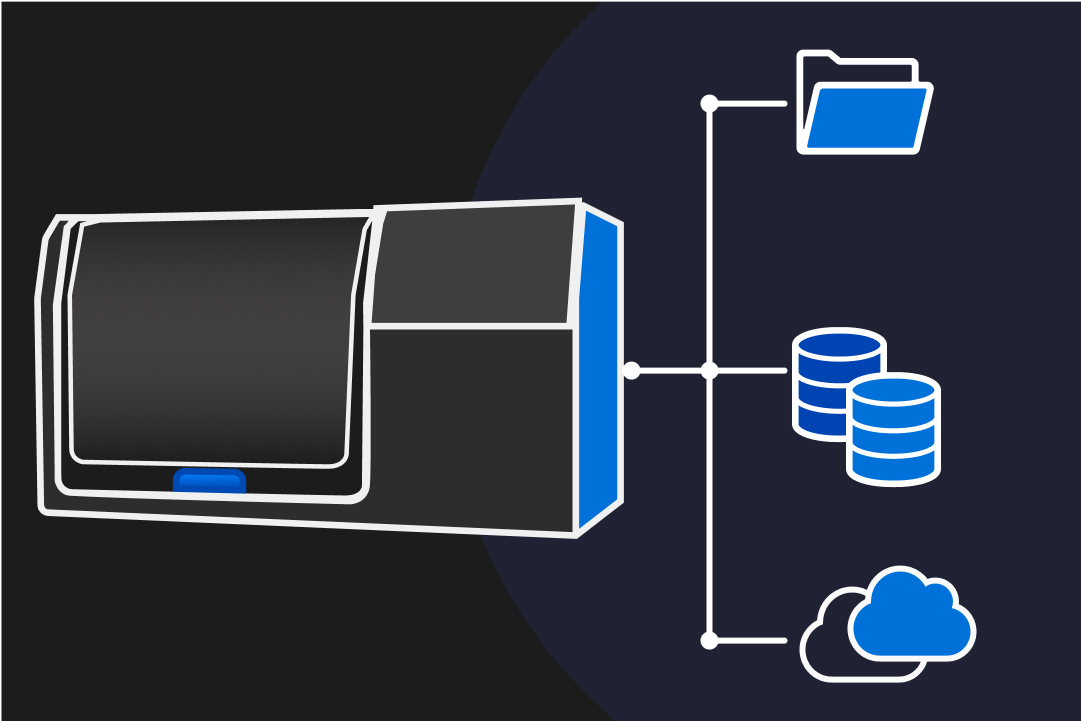
Freedom to store and analyze your data however you choose
Keep full ownership of your data at no extra cost
Transfer data from the instrument to a storage location of your choosing. Your data is yours, at no additional charge.
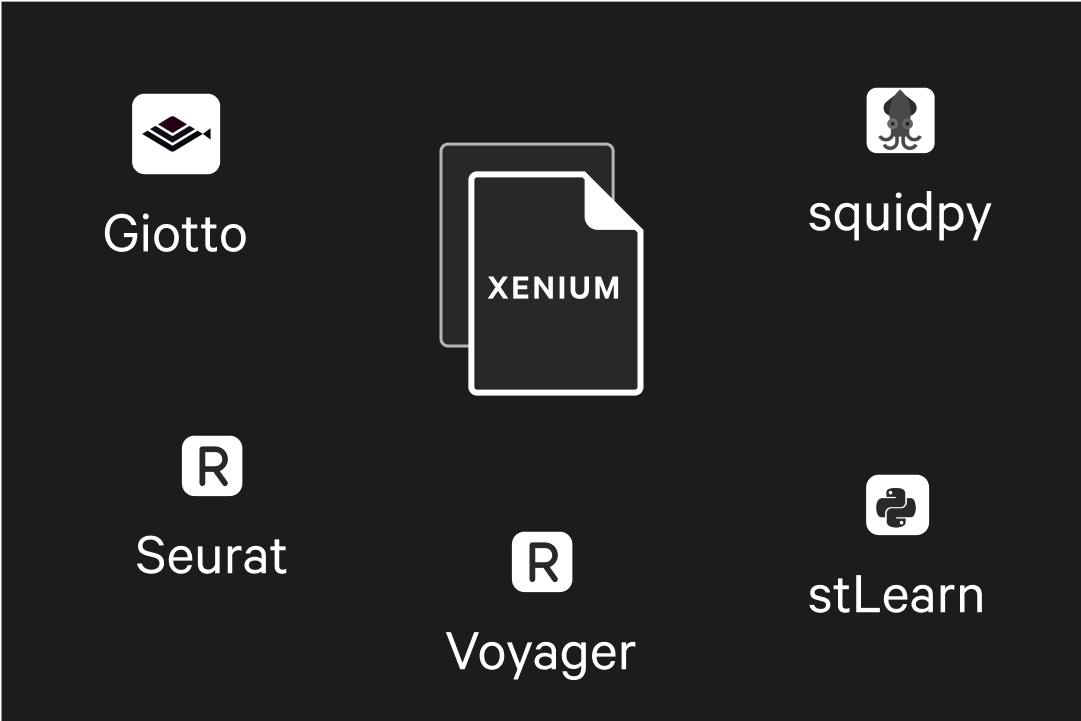
Flexible open file formats without additional processing
Xenium Analyzer generates data in open formats, allowing you to use them with Xenium Explorer or community software.
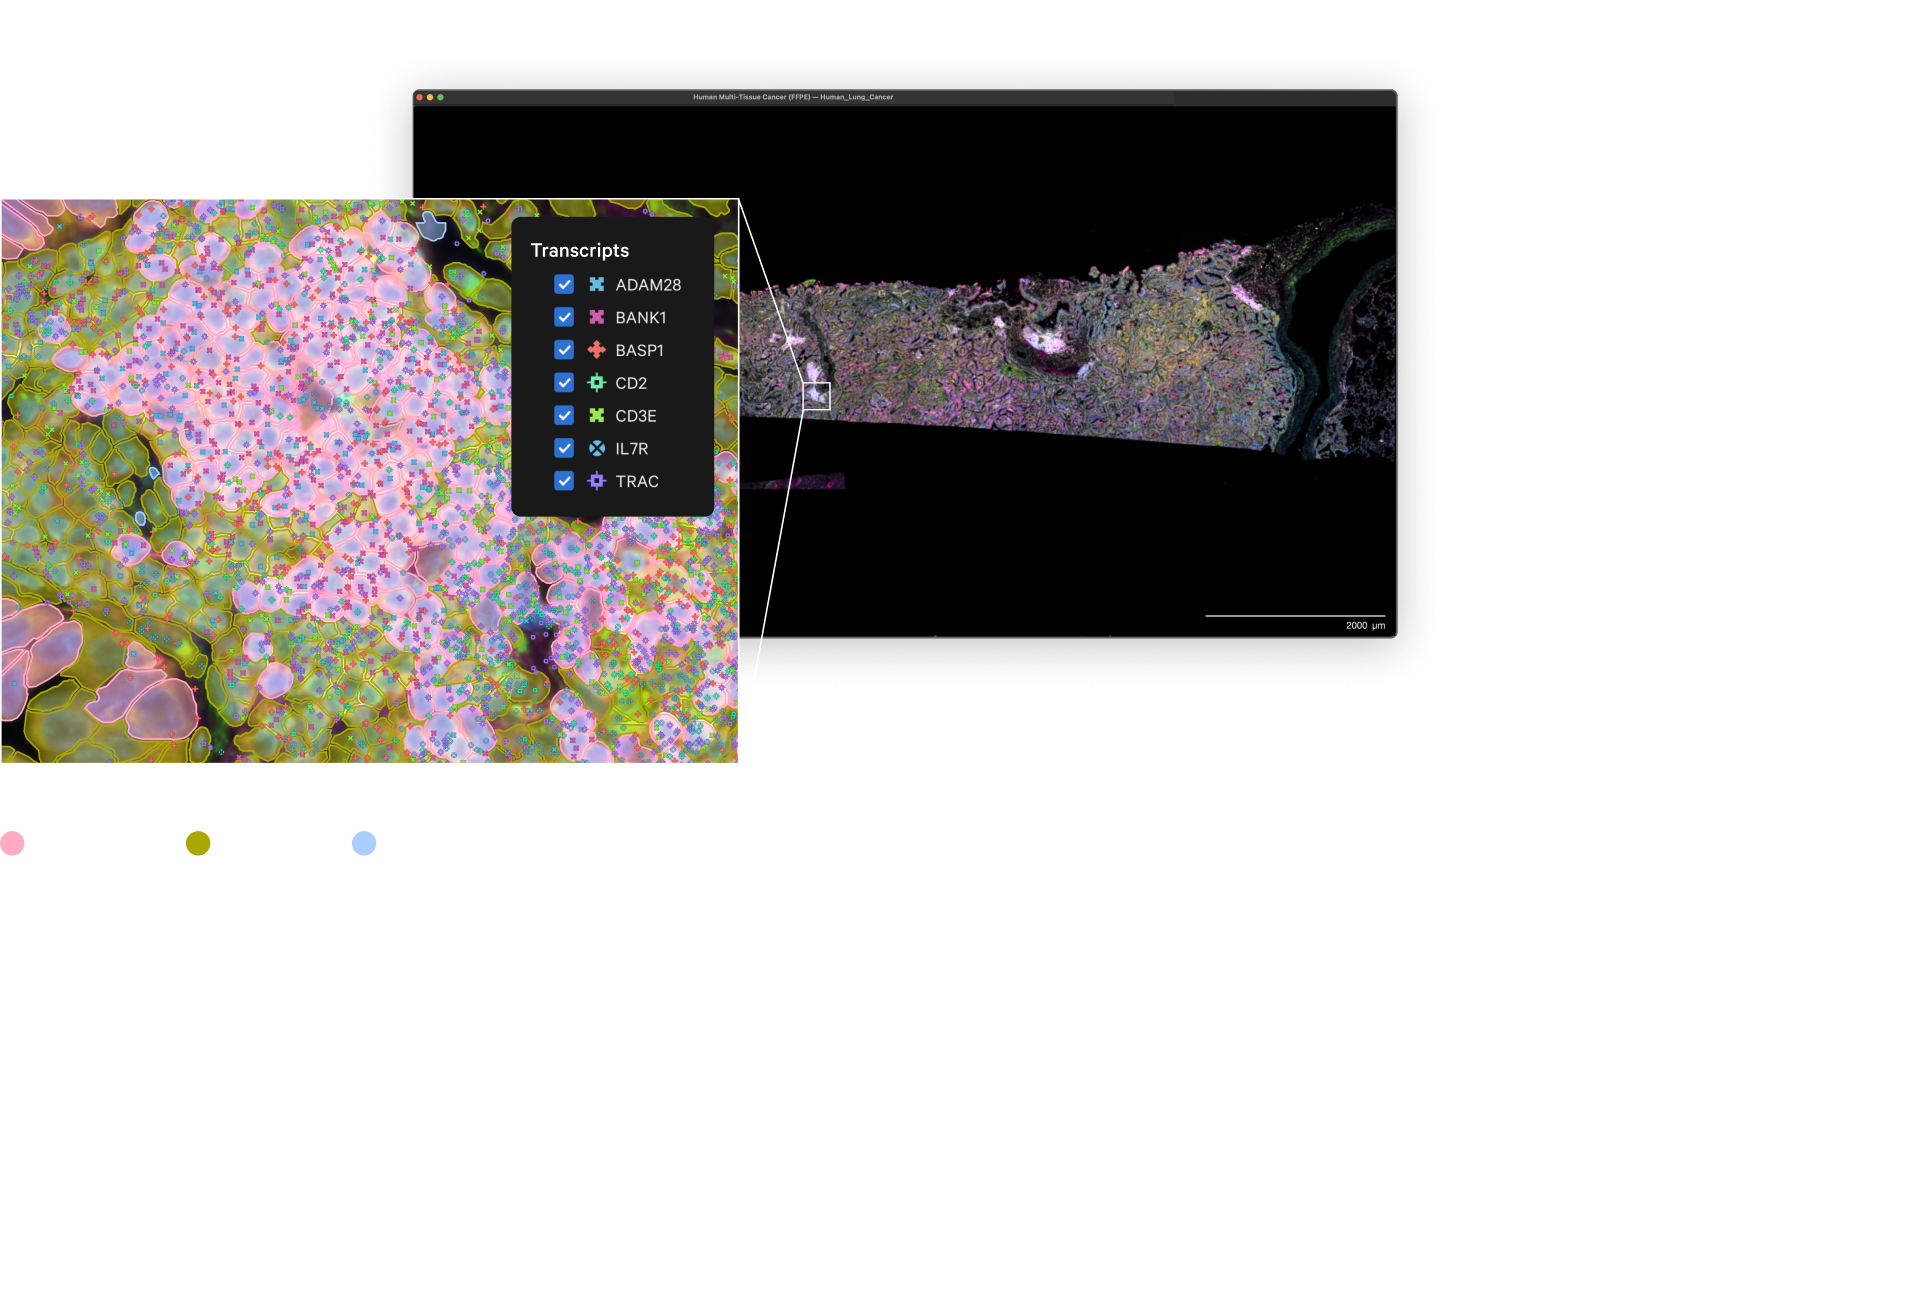
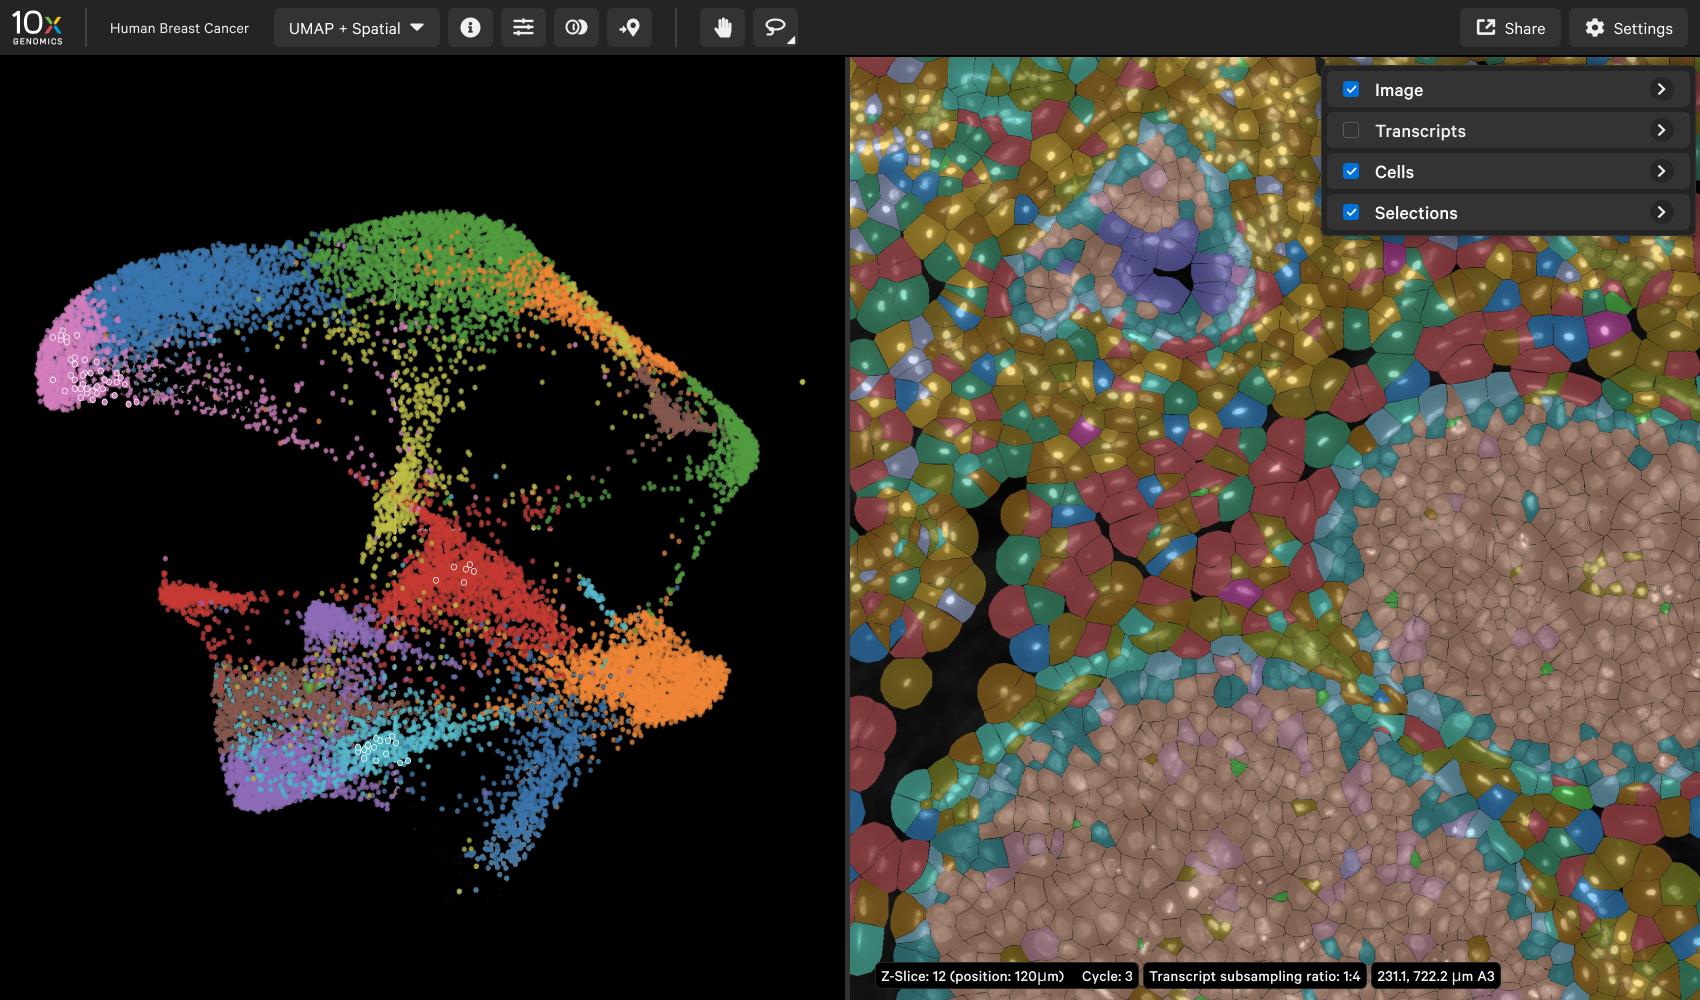
Seamless exploration of whole tissues to single transcripts
Xenium Explorer is a desktop application for Windows and MacOS that allows you to interactively visualize data generated by the Xenium Analyzer instrument.
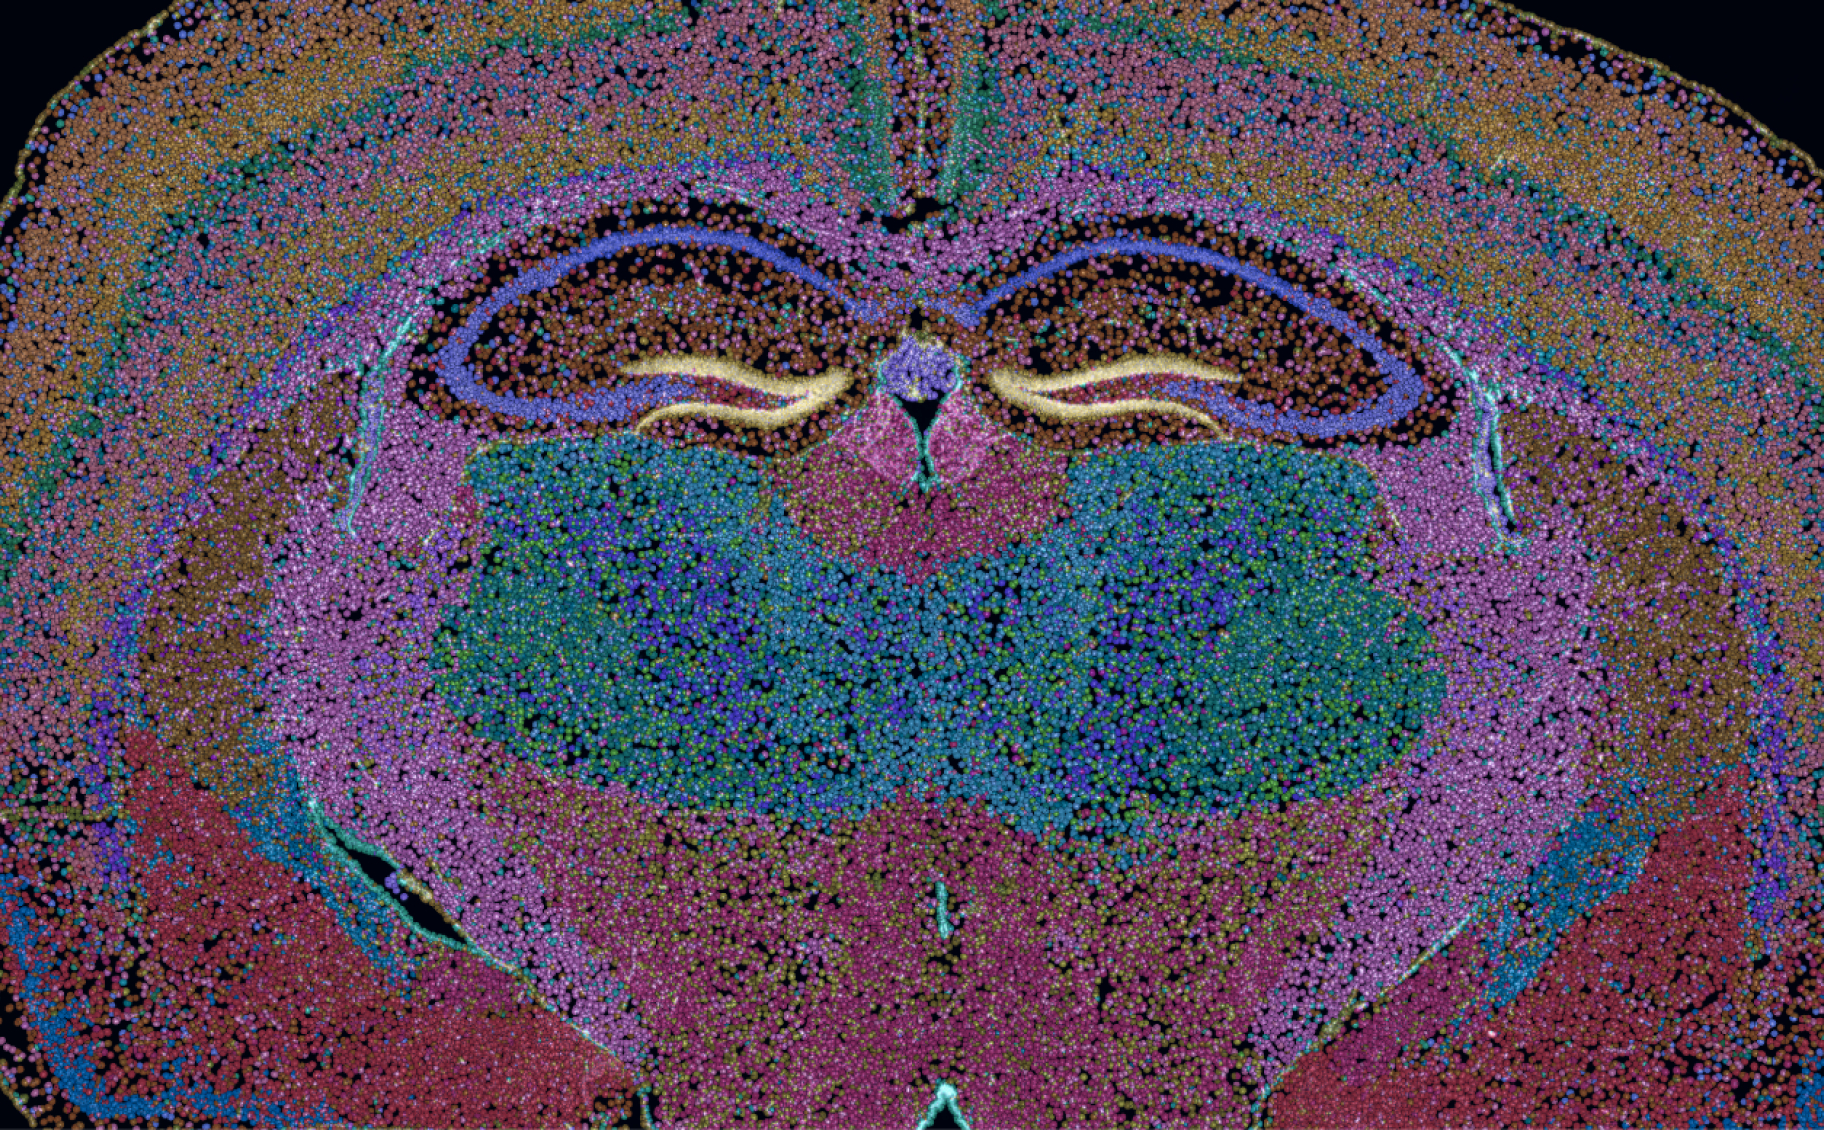
View transcript localization at any scale
Xenium Explorer provides multiple high-performance options to visualize transcript data. At the tissue level, view a transcript density map or color cells by transcript density. At the cell level, zoom in to individual transcripts.
Compare gene expression and cellular neighborhoods
Locate unique spatial niches then leverage the lasso tool to easily compare gene expression in different tissue microenvironments.
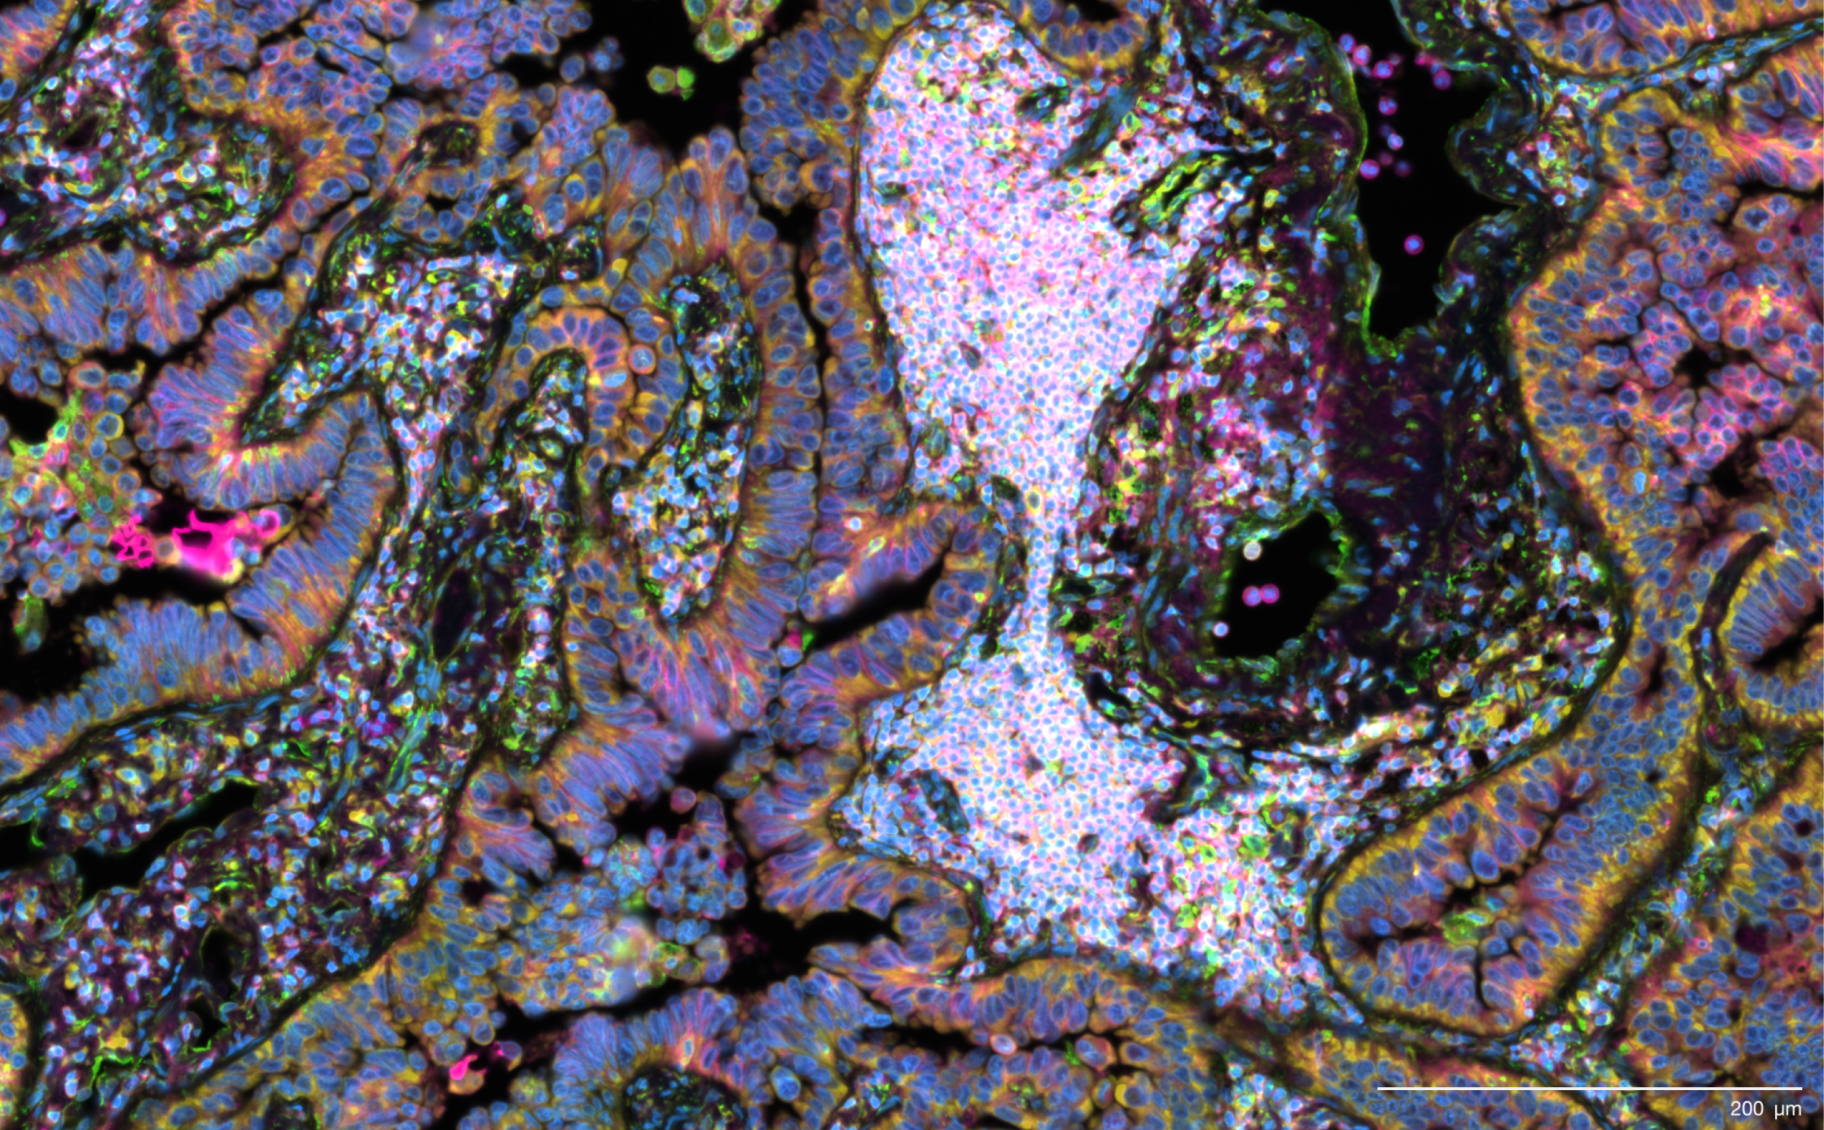
Integrate with pathology workflows
Seamlessly align and explore Xenium data directly overlaid on H&E and DAPI images from the same section.
Align IF images to explore the link between RNA and protein
Use a simple interface to register and view same section H&E and IF images directly in Xenium Explorer.
More features coming in future releases
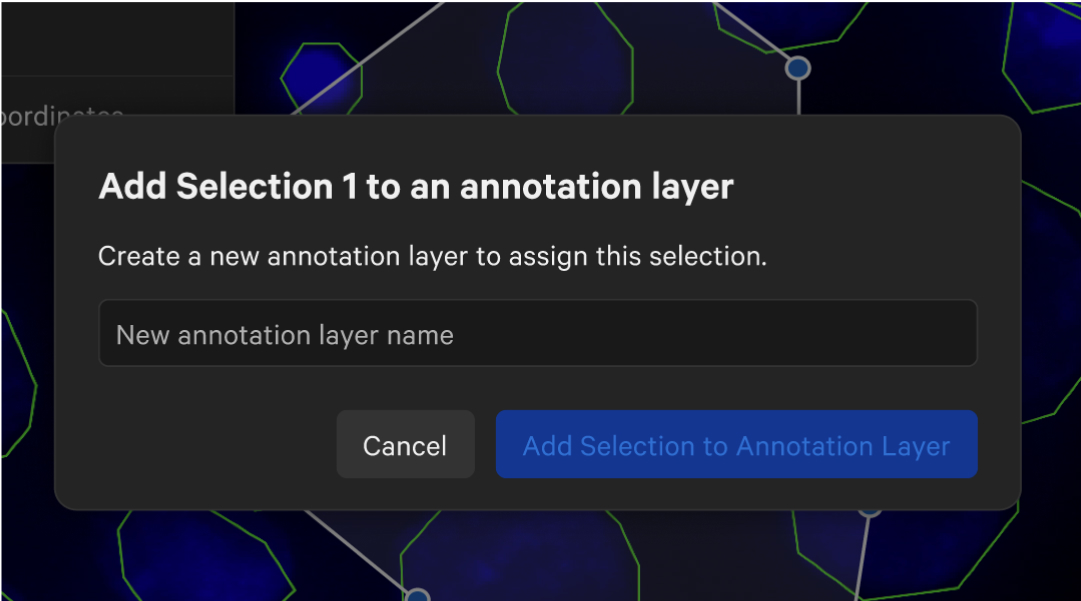
Create pathology annotations
Annotate structures on H&E or IF images and compare to the molecular readout.
Explore UMAP projection
Explore Xenium single cell data in a familiar dimensionality reduced projection.
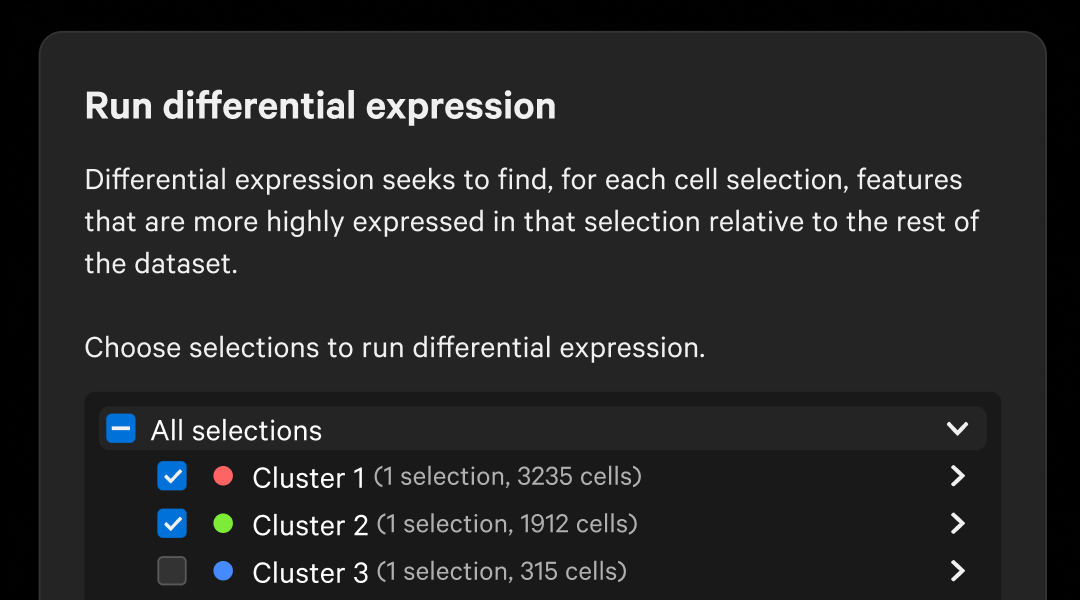
Perform single cell style analysis
Define cell types and clusters, run differential expression, and export high-res figures.
Reanalyze data with Xenium Ranger then visualize in Xenium Explorer
With compatibility across multiple Linux distributions, the Xenium Ranger analysis pipelines make it easy to reanalyze your Onboard Analysis data and visualize it in Xenium Explorer.

Import segmentation
Reassign transcripts in Xenium Ranger using segmentation results produced by a 3rd party tool and visualize in Xenium Explorer.

Resegment
Select the best stains and customize parameters to resegment Xenium data using our latest cell segmentation models and algorithm.

Relabel
Need to relabel transcripts after a Xenium Analyzer run? Use the Relabel pipeline to produce fully corrected Xenium data.
Discover Xenium data
Human Lung Cancer with Multimodal Cell Segmentation
Human Pancreatic Cancer
Mouse Brain Neurobiology
See what customers are saying